

Beyond reporting: why Planning is one of the greatest recent additions to Microsoft Fabric
Reports are good at telling you that something is off: margin is below target, or costs in one region are running ahead of plan. The next question, what we're actually going to do about it, usually gets answered somewhere else.
In a lot of companies, "somewhere else" means Excel. Someone exports the numbers, tweaks a few assumptions, emails the file to department heads and spends the next week chasing replies. Eventually the revised forecast makes it back into a report, often with a couple of manual fixes along the way. If you've ever found forecast_final, forecast_final_v2 and forecast_final_USE_THIS in the same folder, you'll know the feeling.
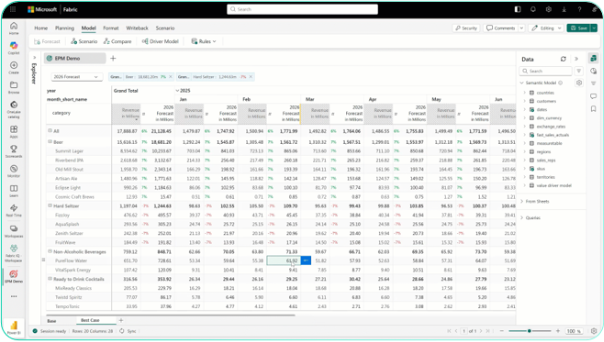
Planning is meant to close that gap and that’s why it is my favourite recent addition to Fabric. Budgets, forecasts and scenarios now sit on the same data and semantic models we already use for reporting. PowerTable, which gets far less attention, gives business users a proper way to maintain the structured data those processes rely on. And after the announcements at FabCon Europe in Barcelona, it's pretty clear Microsoft wants people to make decisions in Fabric as well as analyse data there.
Excel is still fine
I'm not going to pitch Planning as an Excel killer. Excel isn't going anywhere, and I wouldn't want it to. It's flexible, and you can test an idea in ten minutes without raising a ticket with IT. Finance teams use it for good reasons.
Things get messy when one workbook turns into a process that a dozen people depend on. Which file has the latest assumptions? Does the account mapping in it still match the one in the reporting model? Those are questions about ownership and control, and Excel was never built to answer them. So when I look at Planning, what I want to know is whether it makes that kind of process easier to run.
Reusing the semantic model
The thing I like most is that Planning builds on Power BI semantic models. If a company has already put effort into defining its products, departments, reporting hierarchies and measures, budgets and forecasts can reuse those definitions instead of rebuilding them in a separate tool. Plans are written back to a SQL database in Fabric, and from there they go into reports like any other data.
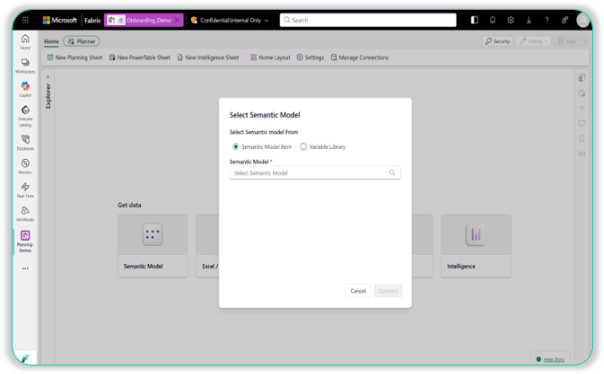
A reporting model usually needs some work before you can plan on top of it. You still have to decide at what level people enter numbers, where the assumptions live, how the calculation rules work and how writeback is set up. Even so, it's a far better starting point than an empty sheet. In my opinion, the fact that semantic models are becoming main sources for every business and reporting process in organization will force IT and Data teams to spend more time developing them with best practices in mind.
Scenarios and comments
Raising next quarter's revenue target takes about five seconds. However, explaining where the extra revenue will come from takes a lot longer: more units, higher prices, a different product mix, or a lower margin in exchange for volume.
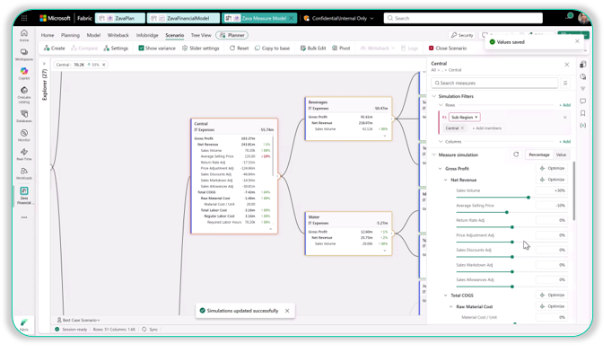
The multi-driver, multi-measure simulations highlighted around FabCon Europe will help with exactly in those kind of scenarios. You can model price and volume together, see what happens to revenue, costs and profit, and compare scenarios before anything is committed. In a well-built model, the discussion shifts to the assumptions behind the target, which is where it should have been in the first place.
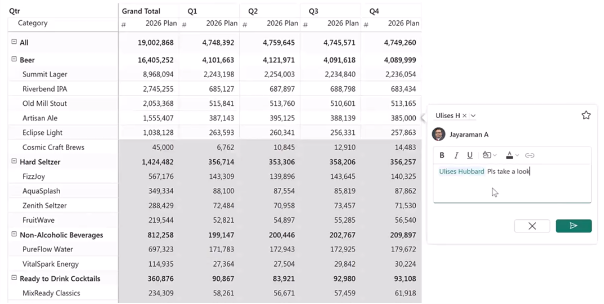
The feature I didn't expect to like as much is comments attached to the data. You can start a discussion on a cell, a row or a column, and it stays where it belongs when someone changes the filters or the hierarchy. It's a small thing, but anyone who has tried to work out why a forecast changed between two versions will appreciate it. That can really help teams to work together on the same numbers and values instead of sending multiple files with questions which one is the right one.
Don't overlook PowerTable
Planning gets most of the attention because budgets and forecasts are easy to link to business value. PowerTable looks less exciting at first glance, and I think it's just as useful. It's an Excel-like grid for structured data, with changes written back to the source. Several people can edit at once, and you get validation rules, approval workflows, permissions and change history.
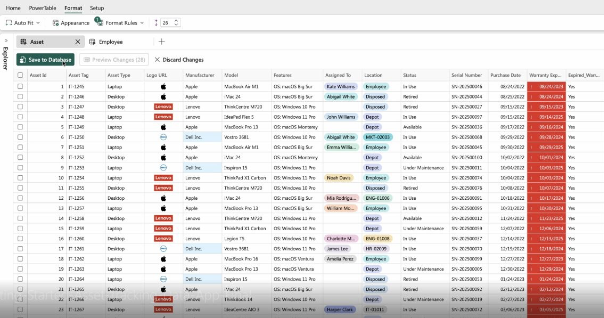
A typical case is the account mapping table that decides how individual accounts roll up into reporting categories. The logic matters a lot, yet it often lives in a spreadsheet, and every change means an email to the data team and a wait for the next update. Nobody tends to notice the mapping is out of date until a new account turns up in the ledger and quietly lands in "Other" for a month. With PowerTable, the people who own the mapping can maintain it themselves, while the organisation keeps control over who can change what. The same goes for planning assumptions, project attributes and any other reference data that sits between source systems and reports.
I see the two as a pair: Planning for working through what might happen, PowerTable for keeping the inputs around it in order. At the end we can interpretate PowerTable as really powerful for Master Data Management. Keeping in mind, that nowadays we have plenty of tools that focus on those processes of proper data management, I think it is good that we have also one dedicated to that available in Fabric, so in many cases we don’t need to use some external systems.
What came out of Barcelona
Most of the headlines from Barcelona were about Copilot, agents or Fabric App (great addition, I’m also a big fan of that), so the Planning updates were quite easy to miss. For me they were the most interesting part, mainly because I work in projects dedicated to financial teams focused on budgeting and financial planning processes.
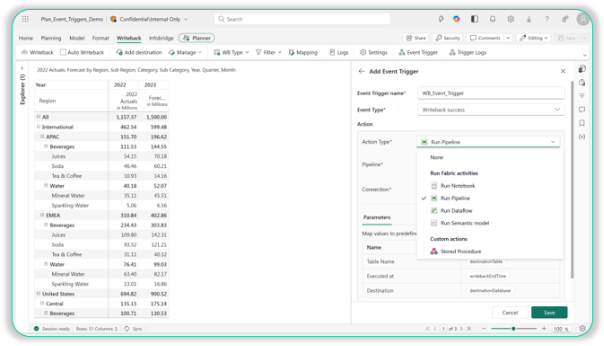
One of interesting updates is that writeback can now trigger events, so saving a plan can start a pipeline, a Dataflow Gen2, a semantic model refresh or a notebook, and notifications can tell people what happened. Triggers can fire when a writeback starts, succeeds or fails, and a planning sheet can have more than one. A submitted forecast could kick off a calculation and then refresh the reporting model. You still have to set up the sequence yourself, but there are far fewer manual handovers between "the plan is done" and "the report shows it".
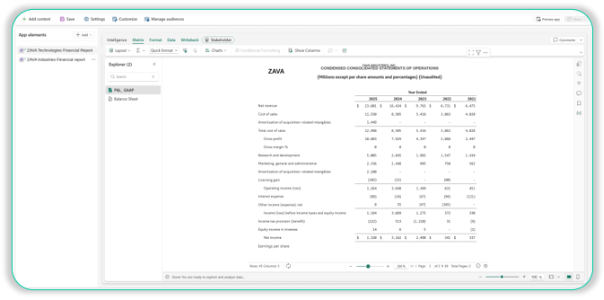
Planning and Intelligence sheets can also go into org apps next to Power BI reports. Business users shouldn't need to know how a Fabric workspace is organised just to review results and update a forecast, so I expect this one to matter more than it sounds.
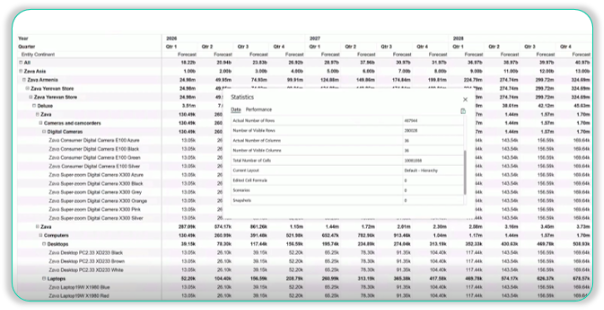
There is also the new Native Planning Engine. It's built on Rust and Apache Arrow, and Microsoft talks about up to 10x better performance and scale, with support for larger models and faster recalculation of dependent values. I'm curious how that holds up on a real model, and since it's in preview, I'd test it properly before relying on it in production. However, I still remember where we started with Planning few years ago (when it was developed as an external tool) and how fast it has developed in previous years. Planning itself has been generally available since July 2026; the newer features each have their own status, so it's worth checking them one by one.
Where I'd start
I wouldn't move every planning workbook into Fabric. A file with years of formulas, macros and exceptions won't turn into a good planning app just because it's on a new platform, and a small spreadsheet someone opens twice a year isn't worth a project.
I'd pick a process that already hurts: lots of consolidation, competing versions, unclear ownership, or a long manual path between submitting a plan and seeing it in a report. A departmental cost forecast is a good candidate. So is sales planning, or a reference table that business users keep asking the data team to update.
Keep the first goal small and easy to measure, like fewer handovers or less time spent reconciling numbers.
What I like about Planning is that it fits work finance teams already do. Nobody has to become a data engineer to use it, and the numbers stay close to the organisation's data, reports and controls. You still need a sensible process behind it. If you've already tried it on a real model, especially with the new engine, I'd be interested to hear how it went.